Skip navigation.
Home

The Greenland_Ice_Sheet_cci data products on SEC + IV + GLL + CFL + GMB + MFID are freely available from the Products Download Page.

The Products Download Page also contain the new R&D SupraGlacial Lakes (SGL) product.

Before starting the first download you will be requested to fill in your name and affiliation.

IV, CFL and GLL products made by ENVEO are also available directly from their CryoPortal: http://cryoportal.enveo.at/.

GMB products made by TU Dresden are also available from https://data1.geo.tu-dresden.de/gis_gmb/.

The surface elevation change (SEC) is a direct expression of climate changes, and closely linked to mass balance of the ice sheet. The SEC is a key essential climate variable, and is a direct measure of the imbalance between the atmospheric forcing and ice sheet dynamics. In the Greenland CCI project SEC is derived from present and past ESA radar altimetry missions, and validated by optical data (such as NASA’s IceSat).

The era of ESA altimetry missions was initiated with ERS-1 in 1992, and data from ERS-2, Envisat, CryoSat-2 and Sentinel-3 have contributed to an unbroken time series from then to present. At present there are multiple satellites in orbit (Cryosat-2 and Sentinel-3A and Sentinel-3B) contributing to the time-series; the later are ensured to be continued, with the operational approach of the EU Sentinel program.

The nature of the radar measurements enables surface penetration in the interior parts of the Greenland ice sheet and the radar measures a reflecting surface within the upper 2 meters of the snow cover, rather than the snow-air interface.

As a by-product of the work on SEC products, also a Digital Elevation Model for Greenland has been generated. 


Click here to browse and download Surface Elevation Change products

Ice velocity and its spatial derivative strain rate (which is a measure of the ice deformation rate) are key variables for estimating e.g. ice discharge and mass balance and are essential input for glacier models that try to quantify ice dynamical processes. Changes in velocity and velocity gradients can point at changing boundary conditions. Remote sensing techniques that utilize SAR and optical satellite data are the only feasible manner to derive accurate surface velocities of the remote Greenland glaciers on a regular basis.

The ice velocity (IV) products generated in the Greenland Ice Sheet CCI are derived from both optical and SAR data using combinations of different techniques. Details of the methods are provided in the Algorithm Theoretical Basis Document (ATBD).

Ice velocity is provided as gridded velocity fields (maps) in NetCDF format with separate files for x and y velocity components (in m/yr). The velocity represents a mean velocity value over a time period ranging from the time span of the satellite repeat-cycle (between 1 to 46 days) to a full season or year for the ice sheet wide velocity maps.

Click here to browse and download Ice Velocity products

Products by ENVEO are also available directly from http://cryoportal.enveo.at/.

CFL for a glacier in Greenland

The Calving Front Location (CFL) of outlet glaciers from ice sheets is a basic parameter for ice dynamic modelling, computing mass fluxes and for mapping glacier area change. From the ice velocity at the calving front and a time sequence of Calving Front Locations the iceberg production rate can be computed which is of relevance for estimating the export of ice mass to the ocean.

The calving front location is derived by manual delineation using SAR and optical satellite data. The digitized calving front is stored as vector lines in standard GIS format. Additionally, metadata information on the sensor and processing steps are stored in the corresponding attribute table. In accordance with the URD, the vector files are provided in ESRI shape-file format.


Click here to browse and download Calving Front Location products

Products by ENVEO are also available directly from http://cryoportal.enveo.at/.

The grounding line location (GLL) marks the position of where a marine terminating glacier starts to float. Understanding the processes at the grounding line of outlet glaciers is important in order to predict the response of the ice to changing boundary conditions and to establish realistic future scenarios in response to climate change.

Principle of deriving GLL from InSAR data. Black line: ice surface elevation above mean sea level from laser altimetry; thick black line: bed topography from radio echo sounding; dashed black line: bed depth calculated from hydrostatic equilibrium; red thick line: tidal flexing measured with ERS-1 DInSAR in millimetre of vertical motion; F: limit of tidal flexing (dotted white line); G: the grounding line (white line);J: line of first hydrostatic equilibrium; I: the break in surface slope; H: maximum extent of the flexure zone, (doted white).

Remote sensing observations do not provide direct measurements of the grounding line position but can be used to detect the tidal flexure zone, using InSAR data, or spatial changes in texture and shading, using optical images, which are indicators of the transition from grounded to floating ice. Due to the plasticity of ice these indicators usually spread out over a zone upstream and downstream of the actual grounding line also called the grounding zone.

In the Greenland Ice Sheet CCI the grounding line location is derived from InSAR data by mapping the tidal flexure zone visible in interferograms. It is generated for selected glaciers with a floating ice tongue.

Click here to browse and download Grounding Line Location products

Products by ENVEO are also available directly from http://cryoportal.enveo.at/.

The Gravity Recovery and Climate Experiment (GRACE) twin satellites have been measuring changes in the Earth’s gravitational field between 2002 and 2017. Its follow-on mission GRACE-FO continues the time series since 2018. Time-variable gravity fields can be used to infer mass changes and mass redistributions in the Earth’s subsystems (e.g. the cryosphere). Mass variations of the Greenland Ice Sheet (GIS) can be measured with an accuracy of around 20 Gt/yr. In order to meet the IGOS (Integrated Global Observing Strategy) requirements as outlined in the GCOS-154 document systematic observation requirements for satellite-based data products for climate - 2011 Update: Supplemental details to the satellite-based component of the “Implementation Plan for the Global Observing System for Climate in Support of the UNFCCC (2010 Update)”, the Greenland Ice Sheet cci (GIS_cci) produces li Mass Balance (GMB) products for the Greenland Ice Sheet from GRACE and GRACE-FO measurements. These products comprise monthly mass change time series for the entire GIS and different drainage basins as well as gridded mass change trends over different 5-year periods between.

GRACE/GRACE-FO data are available from different processing centres, including the Center for Space Research (CSR) at University of Texas, and the GeoForschungsZentrum (GFZ). Here, we use the CSR RL06 solution series (http://www2.csr.utexas.edu/grace/RL06.html), which includes spherical harmonic coefficients up to degree lmax=96.

Monthly spherical harmonic coefficients of changes in the Earth’s gravity field are available for the mission period. Different processing algorithms exist in order to derive the required information from the available data for the GIS. The round robin (RR) exercise carried out during the second phase of GIS_cci by TU Dresden has confirmed that the mass inversion and spherical harmonic filtering methods give comparable results. Therefore the GIS GMB setup is primarily based on the inversion method, method applied by DTU Space, where a direct estimate of mass changes are done in a direct least-squares generalized inverse processing. The choice of this method secures a consistency with the current Danish Polar Portal data (http://polarportal.dk), and a better and more explicit separation of Greenland mass changes from the mass changes from adjacent ice caps, especially northern Canadian ice caps in Ellesmere, Devon and Baffin Island. Details of the inversion method is outlined in the ATBD document. In addition, a second GMB product based on the regional integration approach using tailored sensitivity kernels is provided by TU Dresden.

As specified in the User Requirements Document (URD), user requirements for a gravimetric mass balance product (GMB) were found through a user survey for the Antarctic Ice Sheet cci (AIS_cci). The results were adopted for the GIS_cci. The product requirements for the GMB product are outlined below:

Table: User requirements for ECV parameters
MINIMUM spatial resolution 100 km
OPTIMUM spatial resolution -
MINIMUM temporal resolution Annual
OPTIMUM temporal resolution Monthly
MINIMUM accuracy 20 GT/yr
OPTIMUM accuracy -
What times are observations needed all year

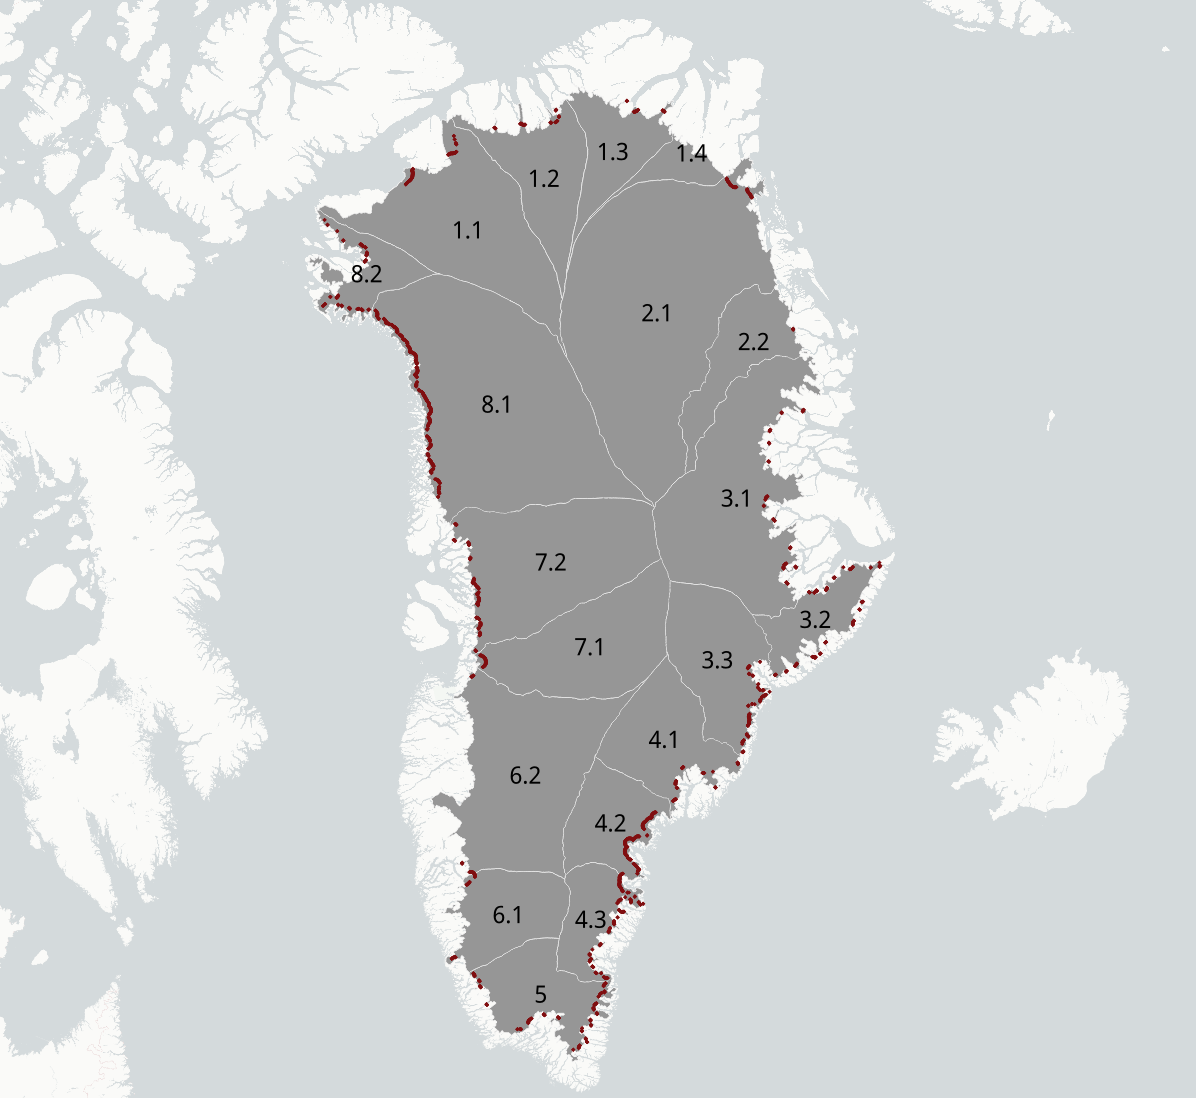
The drainage basins used are an aggregation of those described by Zwally et al. (2012). The figure below shows the outline of the basins. They are also employed for the GMB RR exercise.

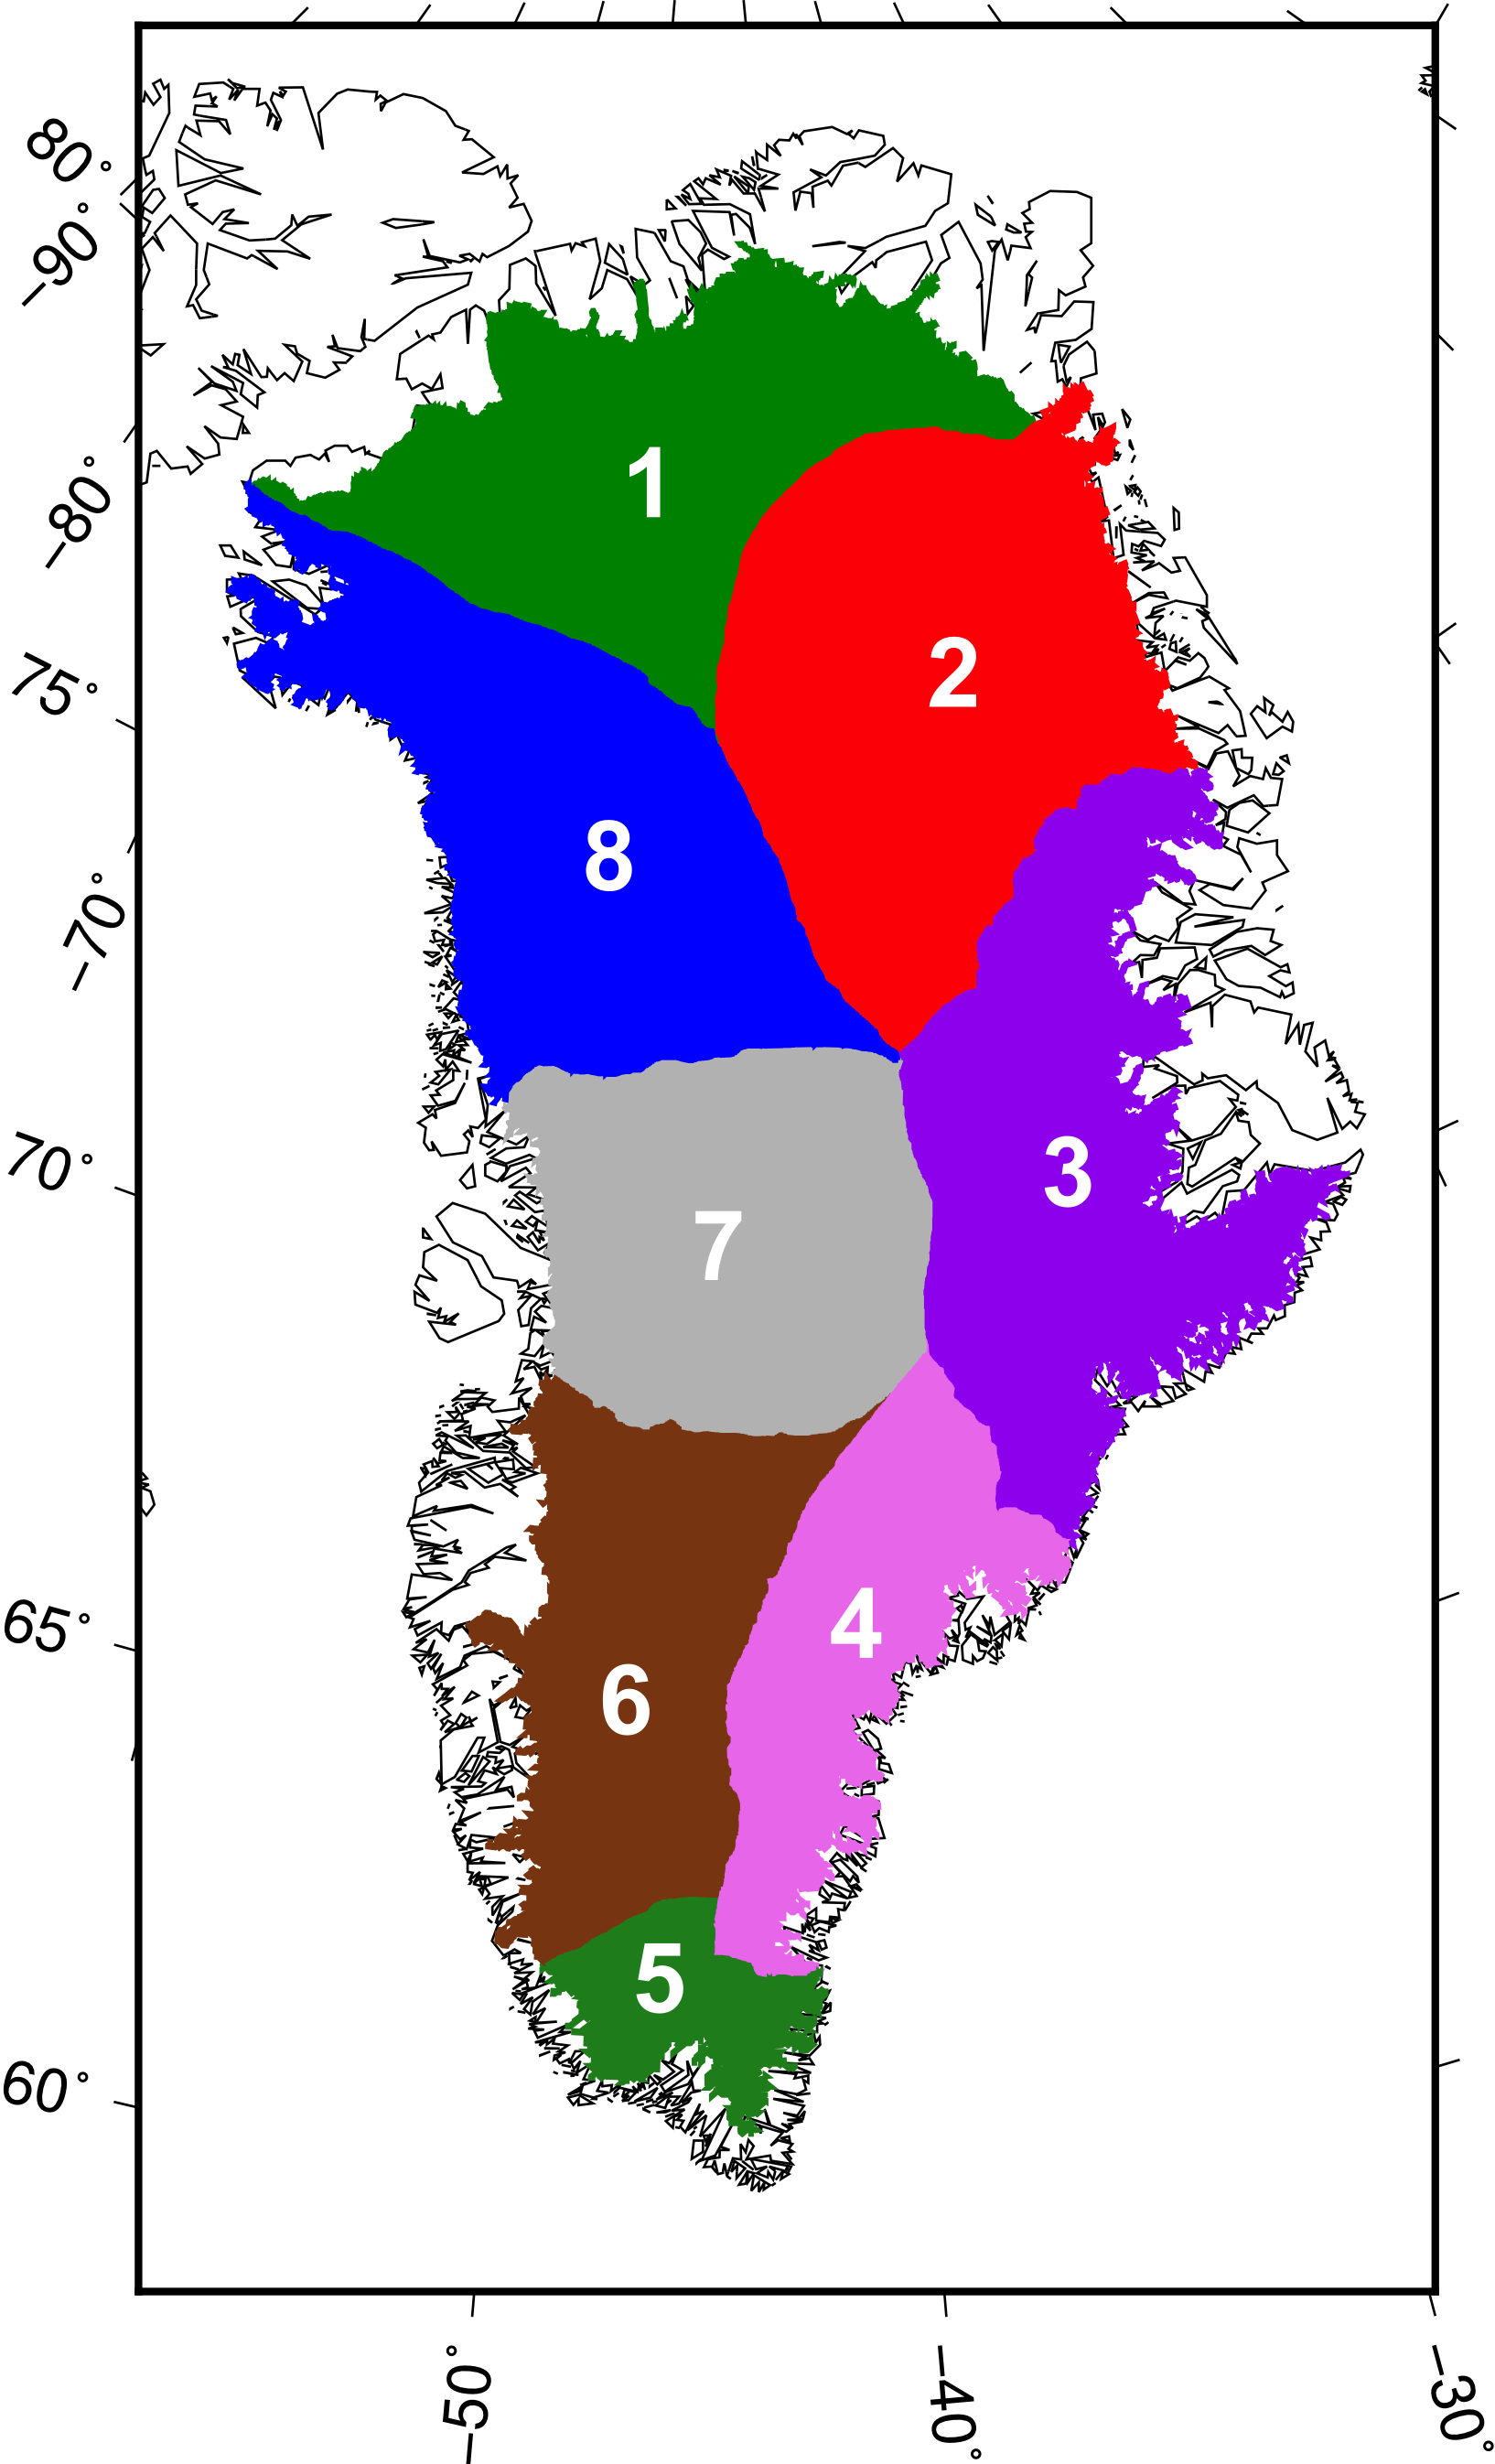
Figure: Drainage basins based on Zwally et al. (2012) in a modified way, which are used for the Basin GMB product.


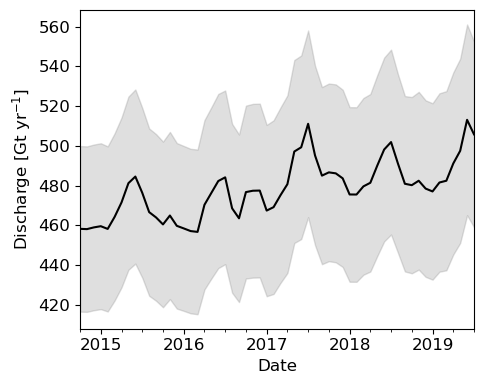
The following movie file shows the CCI Greenland mass loss 2002-2020 from GRACE and GRACE-Follow On, both as a time series for the entire ice sheet, and monthly mass changes. Total mass loss show in Giga-Ton (GT); 362 GT of ice melt corresponds to a global sea level rise of 1 mm. The specific CCI data set is produced TU Dresden, all data available at the links provided below.


Click here to browse and download Gravimetric Mass Balance products

Products by TU Dresden are also available directly from https://data1.geo.tu-dresden.de/gis_gmb/.

Supraglacial Lakes (SGL) are meltwater lakes that form in depressions at the surface of the ice sheet in the ablation zone. Supraglacial lakes are indicators of surface melt, and are a major component of routing and storage of meltwater at the ice sheet surface. These play an important role in the delivery of meltwater to the base of the ice sheet. The delivery of water to the base of glaciers and ice sheets has been observed to influence basal sliding on a range of spatio-temporal scales, as well as play a pivotal role in the seasonal evolution of the subglacial drainage system.

The SGLs are derived from Sentinel-2 optical data using an automated Normalised Difference Water Index (NDWI). These products are produced for selected regions of interest, and version 1.1 is for the Sermeq Kujalleq (Jakobshavn Isbrae) hydrological catchment, as defined by Mankoff et al. 2020. The lake outlines are stored as standard vectorised polygons, with additional metadata stored in the attribute table. The detected lakes are filtered according to maximum recorded surface area and a mask of SGL basins from DEM sink filling is applied to remove false positives. 

A more detailed description of the product, including analysis of elevation and individual lakes, is available in the product report.


Click here to browse and download SupraGlacial Lakes products.

 The product is a R&D CCI+ activity and it is generated by Asiaq (Greenland).

The mass flow rate and ice discharge (MFID) product generated in the Greenland Ice Sheet CCI are derived from the CCI ice velocity (IV) product, the CCI surface elevation change (SEC) product (where it overlaps with the gates), and ice thickness from BedMachine (v3). Ice discharge gates are placed 10 km upstream from all marine terminating glacier termini that have baseline velocities of more than 150 m/yr. Results are summed by Zwally et al. (2012) sectors. Full details of the methods are provided in the ) the Algorithm Theorotical Basis Document (ATBD) or in Mankoff et al. (2019).

The following figure shows the sectors and gate locations within each sector.


MFID is provided as a time series CSV file where each column represents one sector from with units in Gt/yr. Additional files provide error estimates and coverage (a measure of gap-filling).


Click here to browse and download Mass-Flow rate Ice Discharge products.

The product is generated by GEUS. 

The GIS_cci+ project is happy to announce that the following products has just been released: 

  • New SEC product covering the time period 1992-2020 from combination of ERS-1, ERS-2, ENVISAT, Cryosat-2 and Sentinel-3 by DTU Space
  • New GMB product from GRACE satellite gravimetry by DTU Space
  • Update of GMB product from GRACE/GRACE-FO satellite gravimetry by TU Dresden
  • Update of Ice Sheet Velocity from Sentinel-1 data by ENVEO (seasons 2014/15, 2015/16, 2016/17 and 2019/20)
  • Update of Optical Ice Sheet Velocity product for 8 outline glaciers by Science [&] Technology AS
  • Ice Sheet Velocity of Zwally Basin from Sentinel-1 by DTU Space